Something big is happening in the crypto market — and not in a good way.
Bitcoin is breaking below a crucial support level, Ethereum is sliding fast, and the U.S. stock market is pulling back sharply from all-time highs.
That combination has triggered what analysts are calling a full-blown crypto cooldown, and traders are scrambling to react.
Here’s exactly what’s going on, what levels to watch, and how smart traders are positioning themselves right now 👇
📉 The Setup — Stock Market Pullback Sparks Panic
The U.S. stock market has been on fire lately, hitting fresh highs — but this week, that rally has finally started to cool off.
As the NASDAQ and S&P 500 pull back, crypto is following the same pattern.
It’s nothing new — the crypto market has always been highly correlated with the tech-heavy stock market.
And just like we saw during the last flash crash in early October, that stock market correction is dragging crypto down fast.
The warning signs were already there:
- Bearish divergence on the weekly Bitcoin RSI
- Slowing bullish momentum since the end of 2024
- Failed breakout retests near key resistance
Put simply — Bitcoin has been losing steam for weeks.
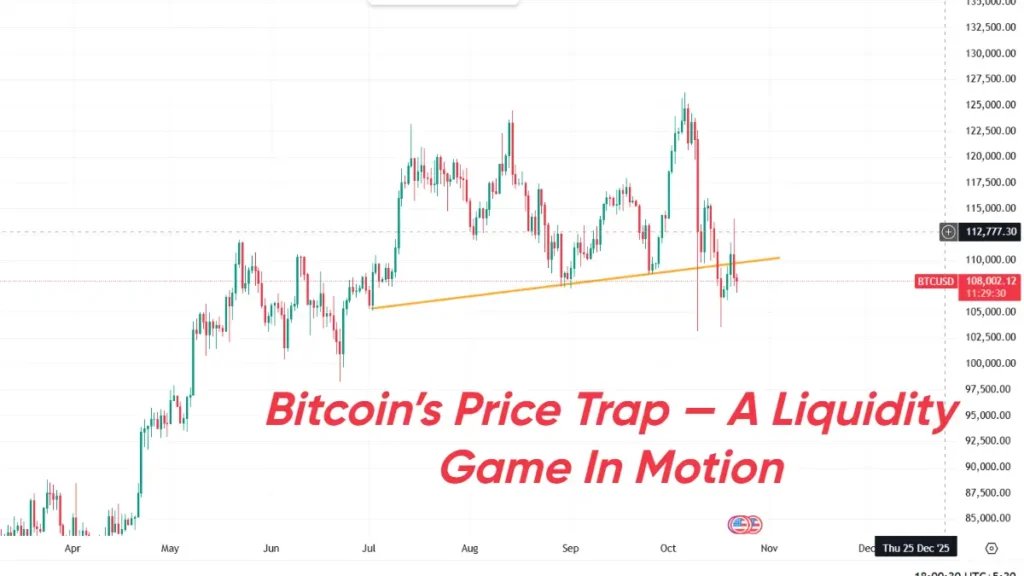
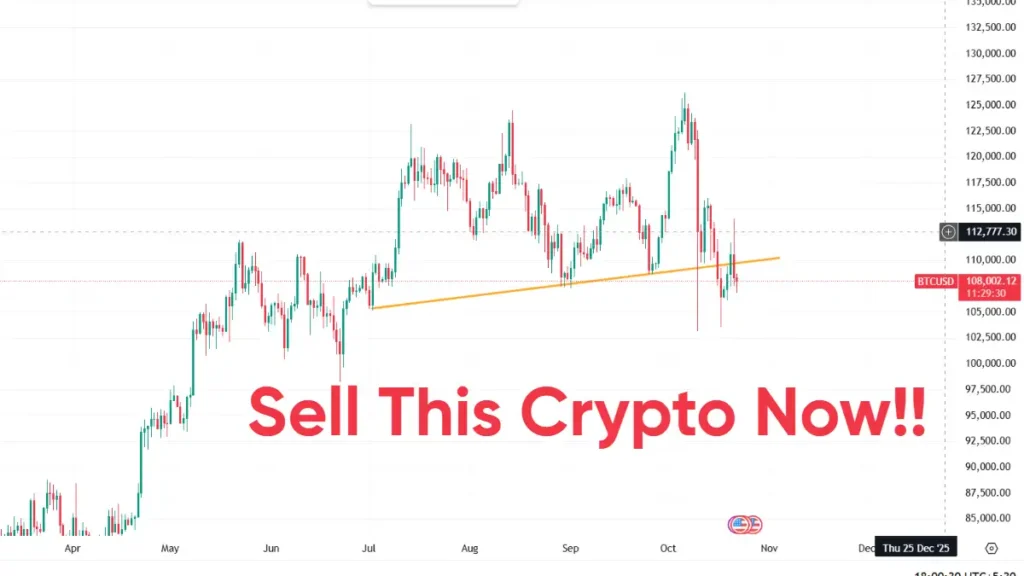
💥 Bitcoin Breaks Support — The Cool-Off Begins
Right now, Bitcoin has officially broken below a critical support zone between $110,000 and $111,000 — a line that’s been holding the market together for months.
That’s a big deal.
This level acted as strong support during the last recovery — and now that it’s broken, traders are seeing signs of weakness across the board.
The latest daily close confirmed the breakdown, with Bitcoin hovering around $109,000 and showing no signs of immediate recovery.
If this level doesn’t hold, the next major supports are:
- $107,000–$107.5K
- $105,000–$105.5K
- $100,000–$101,000
That $100K line will be the ultimate test — a psychological and technical support that could define the rest of this bull cycle.
⚠️ Why It Matters — Bearish Divergences Everywhere
Zoom out, and the picture gets even clearer (and scarier).
The weekly Bitcoin chart is showing a massive bearish divergence — higher highs in price, but lower highs in RSI.
That’s a textbook sign of weakening momentum and an early warning of a deeper correction.
This doesn’t mean the bull market is over — but it does mean we’re likely entering a multi-week or multi-month cool-off phase.
Expect sideways chop, slower gains, and occasional sharp drops before we find a new base.
🧠 My Bitcoin Trading Strategy
So how do you trade a market like this?
Here’s what I’m doing 👇
I’m running a grid bot strategy on Bitcoin — a method that automatically buys during dips and sells during short-term recoveries.
- Buy zone: Between $70,000 and $130,000
- Liquidation price: Around $42K–$43K
- Goal: Capture profit from every small bounce within that range
This kind of strategy thrives in choppy sideways markets like this one — but it only works if the market doesn’t collapse in a straight line.
As long as Bitcoin stays within that range, every bounce back up triggers profits.
It’s not about timing the top or bottom — it’s about collecting small, consistent wins as the market fluctuates.
Not financial advice — but it’s the same approach I’ve used for years to make money in both bull and bear markets.
🧩 Ethereum, Solana, and Altcoins Follow Bitcoin’s Lead
Ethereum’s chart looks eerily similar to Bitcoin’s right now.
After rejecting perfectly from resistance around $4,250–$4,280, ETH broke below its short-term support at $4,060–$4,100.
Now, it’s testing the next big zone between $3,720 and $3,760 — and if that fails, we could see a drop toward $3,000.
Solana (SOL) also rejected hard from the $190–$200 zone, failing to hold its breakout.
Expect new support around $170–$175, with resistance still locked at $200 and $210.
As for XRP, the story’s the same — a textbook rejection from $2.60–$2.70, confirming that the short-term bullish setup has been invalidated.
If momentum continues to fade, XRP could easily revisit $2.30–$2.40 support.
In short:
Bitcoin sneezes, and altcoins catch a cold.
💬 What Comes Next
Even though this correction looks scary, it’s not the end of the bull cycle — it’s a natural cooldown.
We’ve seen this before:
- Big run-up → RSI divergence → Momentum fade → Correction → Next leg up.
That’s how bull markets breathe.
The key levels now are $105K and $100K.
Hold those, and the long-term trend stays intact.
Break below — and we could enter a deeper correction phase heading into early 2026.
Until then, the best move is patience and discipline.
Pravin is a tech enthusiast and Salesforce developer with deep expertise in AI, mobile gadgets, coding, and automotive technology. At Thoughtsverser, he shares practical insights and research-driven content on the latest tech and innovations shaping our world.